在windows开发的过程中,经常会碰到这样的问题:我们需要记录一些程序的运行期间的信息(log),但是又不想直接记录成log文件保存在用户磁盘上。一般在develop的过程中,我们会将 一些信息直接输入到console或者visual studio中的Output窗口中,但是一旦release给用户之后,我们无法获取这些信息。
That’s where DebugView COMES IN!
介绍
DebugView原来是sysinternals开发的一系列工具包中的一个,现在早已被MS收购。简单来说,这个工具可以用来显示打印到Debug output windows中的信息。比如使用WIN32 OutputDebugString中的消息在visual studio中可以在output windows中查看的信息。但是在release build版本中,可以通过DebugView工具查看。
DebugView is an application that lets you monitor debug output on your local system, or any computer on the network that you can reach via TCP/IP. It is capable of displaying both kernel-mode and Win32 debug output, so you don’t need a debugger to catch the debug output your applications or device drivers generate, nor do you need to modify your applications or drivers to use non-standard debug output APIs.
DebugView能做的
Under Windows 2000, XP, Server 2003 and Vista DebugView will capture:
- Win32 OutputDebugString
- Kernel-mode DbgPrint
- All kernel-mode variants of DbgPrint implemented in Windows XP and Server 2003
DebugView also extracts kernel-mode debug output generated before a crash from Window’s 2000/XP crash dump files if DebugView was capturing at the time of the crash.
就是说DebugView可以抓取到程序中的OutputDebugString, DbgPrint等函数调用。在.net中,同样抓取System.Diagnostic.Debug.WriteLine输出的信息。
基本功能
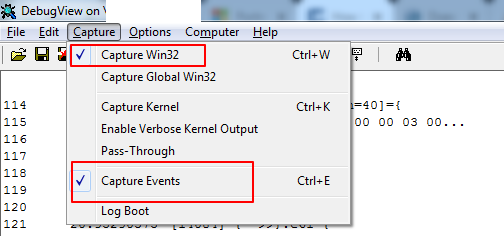
使用DebugView很简单,只需要设置下需要capture的类型,如下图只capture win32 调用OutputDebugString的输出,capture events指的是开始/暂停 捕捉。
使用highlight高亮功能
log一多久容易迷失方向,使用highlight功能,方便查找含有特定字符串的信息。注意是在include中输入通配符,然后在highlight下输入要包含的关键字,如下图。注意,在include中一般直接输入通配符*,如果想只显示包含特定字符的信息,可以输入关键字,多个关键词已;隔开。
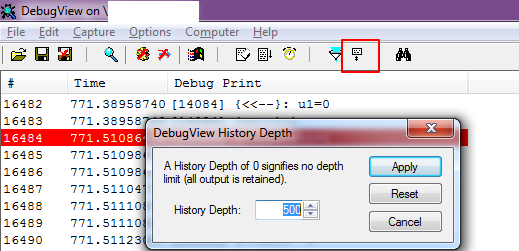
设置最多显示多少条记录
如下图,这样在GUI中只会显示最新的500条记录。
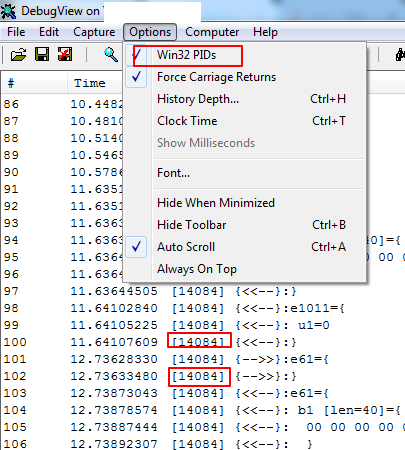
显示PID
在option中可以设置是否显示进程的PID,如果勾选,则在每一行中都会显示进程的PID。这个功能可以配合highlight高亮功能,用来关注特定进程的log信息。
查看帮助文档
以上只是debugview的简单功能的介绍,详细功能使用可以参考下载包里的帮助文件:dbgview.chm。